

The Y'all Street Physical Gold ETF
Physical Gold. Cost Efficient. 100% American.
The Y’all Street Physical Gold ETF (“YSAU”) provides investors with a convenient and cost-effective way to hold allocated gold and is the only ETF of it’s kind to offer investors 100% American storage.


Segregated Physical Bars
We only deal in real physical gold. Every share represents a fractional ownership of physical gold bullion from members of the LBMA Good Delivery List held in our secure American vaults.
No Foreign Storage
YSAU gold is stored at Texas Precious Metals Depository and never uses foreign depositories or vaults.
Texas as a Strategic Advantage
The Y’all Street Physical Gold ETF prioritizes Texas as a vaulting jurisdiction and allows Americans to bring their gold home.
No Unallocated Claims
YSAU never uses unallocated claims on gold and instead settles and holds all gold in physical bars.
Frequently Asked
Questions
All gold held by the ETF is stored in fully allocated, segregated form at Texas Precious Metals Depository.
The ETF does not currently support physical delivery. Shares can be bought and sold on the NASDAQ exchange like any other ETF.
The fund has an expense ratio of 0.24%, making it one of the most cost-effective physically backed offerings in its category.
Y’all Street ETFs can be purchased through any brokerage account that supports NASDAQ-listed securities.
*The LBMA PM Gold Price is the afternoon (PM) benchmark price for unallocated gold delivered in London and is administered by ICE Benchmark Administration. The benchmark reflects the U.S. dollar price of gold per troy ounce and is based on the wholesale market for gold.
The Fund has limited or no operating history and therefore does not have performance history for the periods shown. As a result, the performance of the LBMA PM Gold Price is presented for informational purposes only to provide a general indication of the historical performance of the gold market.
The LBMA PM Gold Price is an unmanaged benchmark and is not an index in which investors can invest directly. Benchmark performance does not reflect the deduction of fees, expenses, or taxes, which would reduce returns. The benchmark reflects only changes in the price of gold and does not include any income, as gold does not generate yield.
The Fund’s investment strategy, fees, expenses, and holdings may differ significantly from those of the benchmark. The Fund may not track the performance of the price of gold and may perform differently due to a variety of factors, including but not limited to management fees, operating expenses, portfolio implementation, trading costs, liquidity constraints, and other market factors.
In addition, the benchmark reflects the spot price of gold and does not account for the costs associated with buying, storing, insuring, or transporting physical gold, which may be borne by the Fund either directly or indirectly.
The benchmark is shown for illustrative purposes only and should not be considered a proxy for the Fund’s performance. Past performance of the benchmark is not indicative of future results.
Month-end Return
as of Sep 30, 2026| 1 Month | 3 Month | 6 Month | YTD | Since InceptionJul 15, 2026 | |
|---|---|---|---|---|---|
| Fund Nav | -8.41% | – | – | – | 2.40% |
| Closing Price | -6.55% | – | – | – | 2.08% |
| 1 Year | 3 Year | 5 Year | 10 Year | |
|---|---|---|---|---|
| Fund Nav | – | – | – | – |
| Closing Price | – | – | – | – |
Quarter-end Return
as of Sep 30, 2026| 1 Year | 3 Year | 5 Year | 10 Year | Since InceptionJul 15, 2026 | |
|---|---|---|---|---|---|
| Fund Nav | – | – | – | – | 2.40% |
| Closing Price | – | – | – | – | 2.08% |
Performance data quoted represents past performance and does not guarantee future results. The investment return and principal value of an investment will fluctuate so that an investor’s shares, when redeemed, may be worth more or less than their original cost. Current performance may be lower or higher than the performance data quoted.
The fund is new and therefore does not have a performance history for a full calendar year as of the most recent quarter-end. Returns less than one year are cumulative and returns over one year are annualized.
Market Price Return is calculated using the price which investors buy and sell ETF shares in the market. The market returns in the table are based upon the midpoint of the bid/ask spread at 4:00 pm EST, and do not represent the returns you would have received if you traded shares at other times.
NAV Return represents the closing price of the underlying securities.
Premium/Discount
Data as of: Oct 13, 2026| Q3 2026 | Q4 2026 | |
|---|---|---|
| Days at premium | 33 | 8 |
| Days at zero premium/discount | 1 | 0 |
| Days at discount | 22 | 1 |
The premium/discount shows the difference between the daily market price of the fund’s shares and the fund’s net asset value (“NAV”). The table shows the premium or discount of the mid-point price as a percentage of the NAV as well as the number of trading days the fund traded within the given premium/discount range.
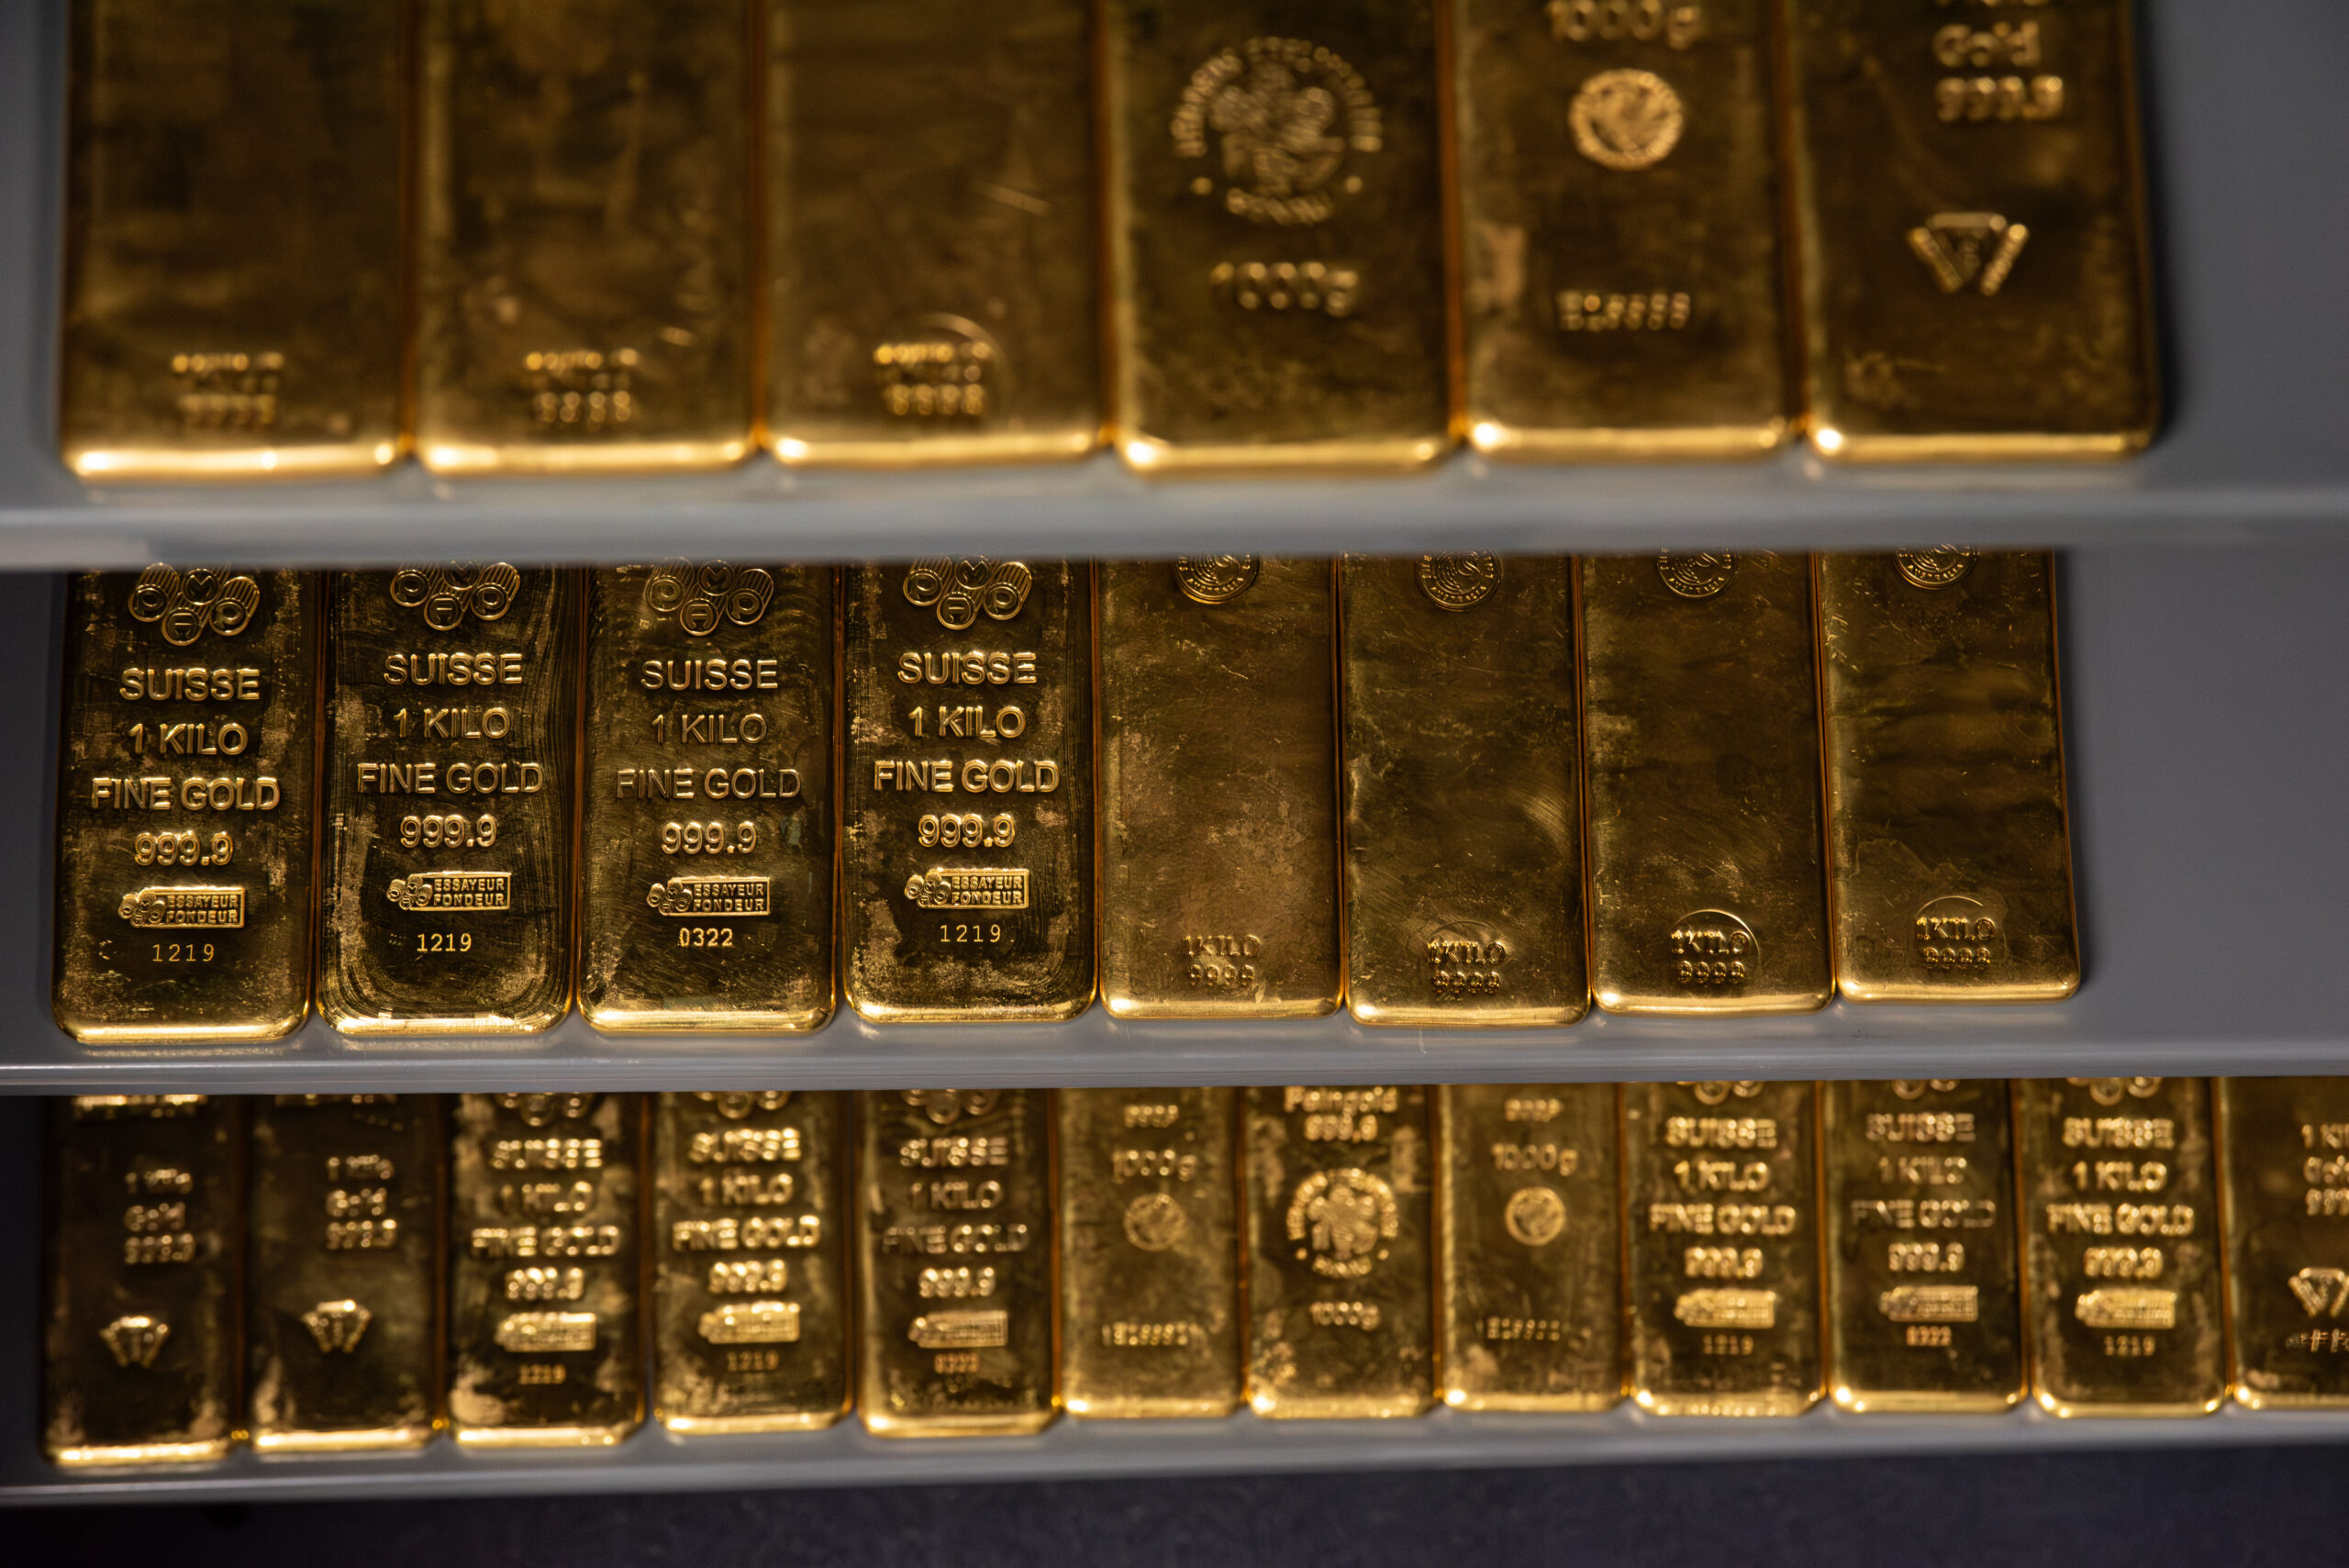
Fund Holdings
Download Full Bar List (PDF)