



Oil Prices Fall Despite Houthi Strikes on Saudi Arabia
Crude eased toward $90 a barrel Monday even after the deadliest Houthi attacks on Saudi Arabia since the war began, as hopes for a Russia-Ukraine energy truce took the edge off supply fears.
Market Snapshot
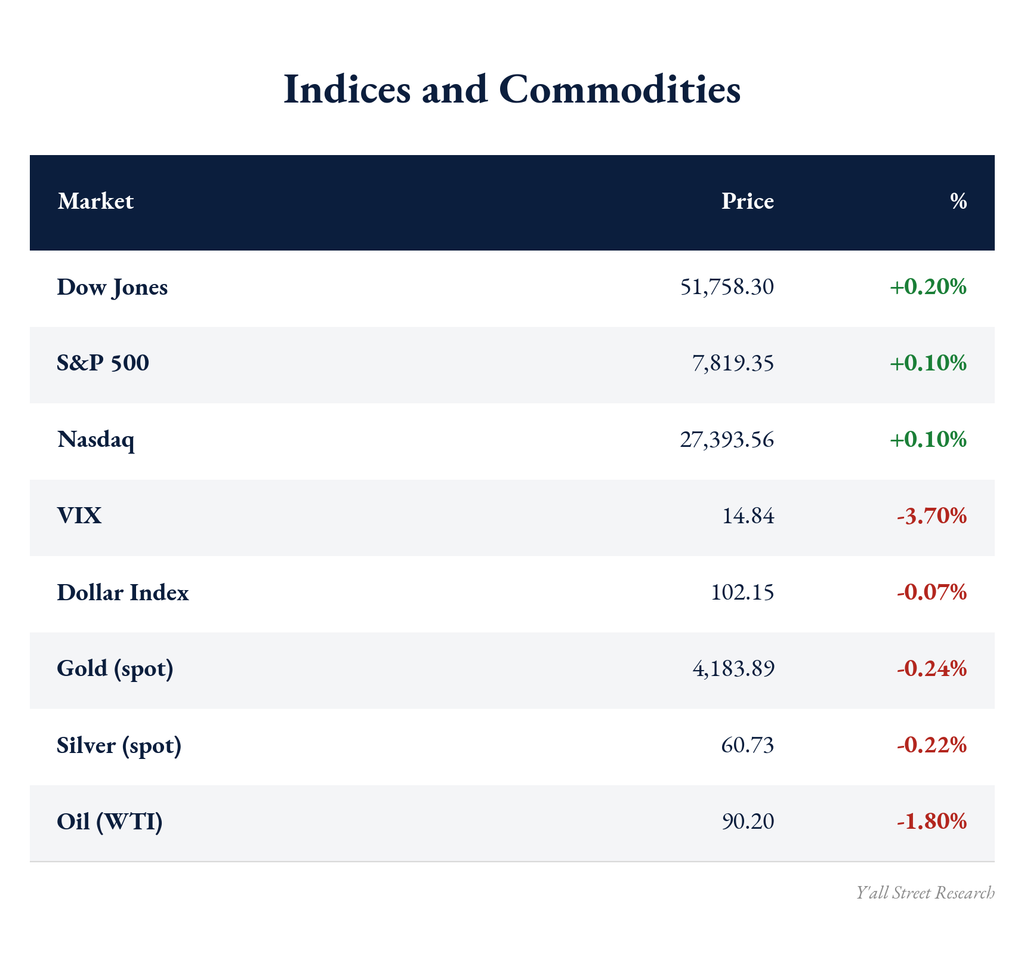
All figures are indicative opening levels as of this morning, October 12.
Equity futures traded close to flat heading into a week packed with bank earnings and CPI data.
Oil eased toward $90 a barrel even after the deadliest Houthi strikes on Saudi Arabia since the war began, as hopes for a Russia-Ukraine energy truce took the edge off supply fears.
Gold and silver slipped modestly alongside a steadier dollar.
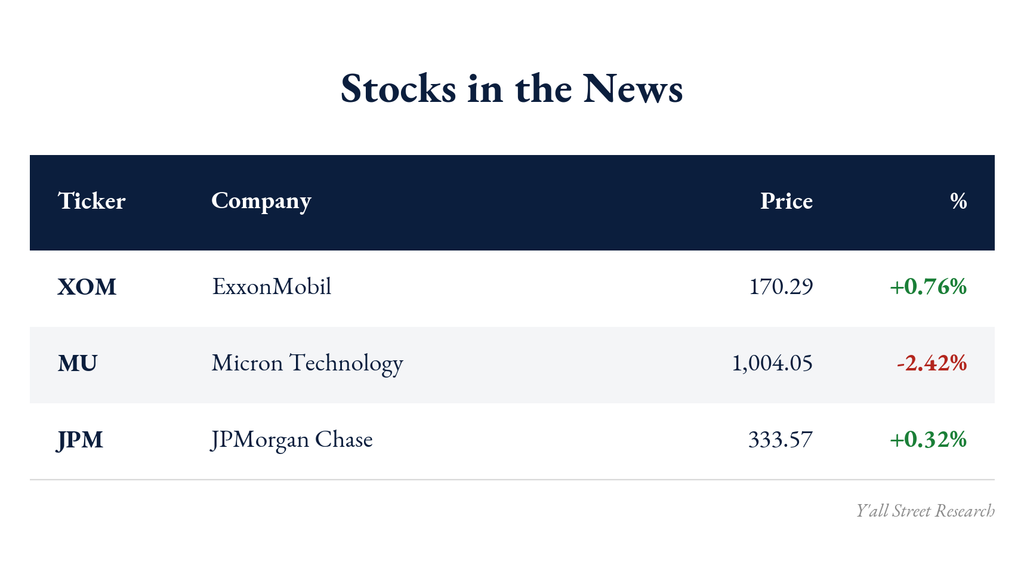
ExxonMobil firmed with crude’s volatility, Micron gave back recent AI-driven gains on fresh China competition worries, and JPMorgan held steady ahead of Tuesday’s bank earnings kickoff.
Main Story
Markets spent the weekend digesting a sharp Middle East escalation that oil prices, for now, are shrugging off.
- Houthi strikes on Saudi Arabia’s Abha and King Khalid airports between October 6 and 11 killed 19 people and injured more than 350, the deadliest attack on a Gulf Arab state since the war began, briefly pushing Brent above $105 and WTI toward the mid-$90s.
- The mainstream explanation for oil’s pullback despite that escalation is Russia’s pledge, under a new Russia-Ukraine energy ceasefire, to supply more than 4 million tons of diesel to global markets.
- What the market may be underpricing is how fragile that offset is, since oil could reverse quickly if the ceasefire falters or Houthi attacks spread toward Red Sea and Strait of Hormuz shipping lanes.
Chart of the Day
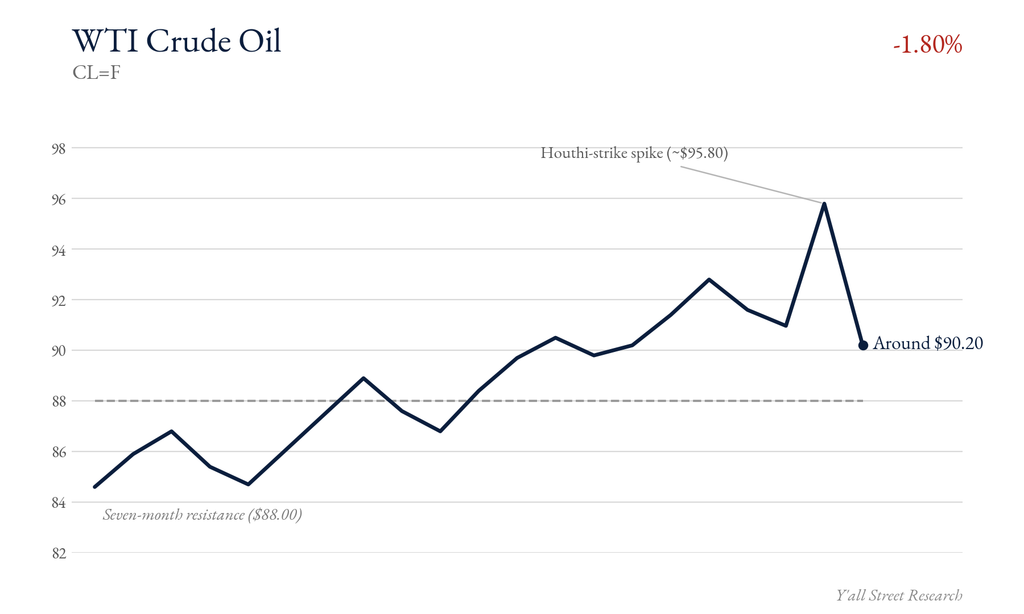
WTI spiked toward the mid-$90s over the weekend as Houthi strikes tore through two Saudi airports, the deadliest attack on a Gulf Arab state since the war began.
Prices have since eased back toward $90, slipping below the Bollinger mid-band near $91.90 as Russia’s diesel pledge gave the market a supply valve.
The question now is whether $88, the old seven-month resistance, holds as support if tensions flare again.
Technical Trading
A few levels drawn from technical analysis on WTI crude oil:
- RSI(14) reads near 49, a neutral reading after momentum cooled from last week’s spike.
- WTI is holding above its seven-month resistance-turned-support near $88.00, keeping the broader uptrend structurally intact.
- Next resistance sits at the Bollinger mid-band near $91.90, then the July high near $94.00; support lies near $85.15 and the 100-day moving average around $84.10.
Global News
- Houthi strikes on Saudi Arabia’s Abha and King Khalid airports between October 6 and 11 killed 19 and injured more than 350, the deadliest attack on a Gulf Arab state since the war began.
- Iran has reportedly offered to broker talks between Saudi Arabia and the Houthis, a potential de-escalation signal markets are watching for oil-price direction.
- Trump announced a Russia-Ukraine energy ceasefire under which both sides stop striking energy infrastructure, with Russia supplying over 4 million tons of diesel to global markets.
- South Korean equities fell roughly 3 percent after the holiday weekend on renewed AI-stock weakness, a contrast to modestly higher European and US futures.
- Wednesday’s CPI report, expected near 0.6 percent month over month and 3.6 percent year over year, arrives alongside a wave of bank earnings and will shape the Fed’s rate path.
Texas News
Dallas-based Energy Transfer finalized its roughly $2.625 billion acquisition of Vaquero Midstream this month, adding a 300-mile Permian Basin pipeline network and the Caymus Processing Complex.
The deal expands gas-gathering capacity toward 1.2 billion cubic feet a day as Permian output keeps climbing.
.
Looking Ahead
Tuesday, October 13: JPMorgan Chase, Goldman Sachs, Wells Fargo, and Citigroup report third-quarter earnings before the opening bell, the first broad test of how the biggest banks are navigating higher-for-longer rates.
Wednesday, October 14: September CPI data lands, with consensus near 0.6 percent month over month and 3.6 percent year over year, giving the market its clearest read yet on the Fed’s rate path.
The Y’all Street Podcast
In Episode 50, Tarek sits down with entrepreneur, investor and film producer J. Eustace Wolfington to trace the origin of Half-A-Car and how challenging the traditional way Americans bought cars helped reshape the modern leasing model. Wolfington shares the eight principles his father gave him at Notre Dame, the persistence it took to win over Ford and thousands of dealerships, and the story behind producing the films Bella and Cabrini.
Prices from Yahoo Finance, CNBC and Fortune. Technical levels from Investing.com and FXStreet. News from Reuters, Al Jazeera and CNBC.
For informational purposes only. Not investment advice. Prices are indicative opening levels and may differ from your broker.